Event data analytics is the practice of collecting and reading the data an event produces, from the first registration to the last follow-up email, so the next decision rests on evidence instead of memory. The work is easiest when registration, payments, sessions, check-in, exhibitor activity and surveys sit in one record. rsvpBOOK has supported event organizers since 2004 and is built around that idea: one data record across every stage of an event.
This guide covers what the data includes, which KPIs matter, how to calculate ROI, and how to avoid the mistakes that make good numbers misleading.
TL;DR
- Event data covers the whole lifecycle: registration, payments, attendance, session and booth engagement, surveys and post-event outcomes.
- Start with objectives. Each goal tells you which few metrics to track, so you avoid a dashboard full of numbers nobody uses.
- ROI is (event return minus event cost) divided by event cost, times 100. Count all costs, including staff time and technology.
- Data scattered across disconnected systems is the main obstacle. A single record with custom reports and automated alerts removes most of the manual merging.
- Check for double counting and biased survey samples before presenting results.
Table of Contents
- What event data analytics includes
- Start with objectives, not metrics
- The KPIs worth tracking
- How to measure engagement across sessions and booths
- Exhibitor and sponsor analytics
- Calculating event ROI
- Post-event analysis: a five-step routine
- Data quality problems to catch early
- Why one connected record matters
- Our perspective
- Put your event data to work with rsvpBOOK
- FAQ
- Sources
What event data analytics includes
Every event creates data whether or not anyone reads it. The useful categories are:
- Registration data: who signed up, which registrant type, which discount, which answers to custom questions, how many registered per week before the event.
- Payment data: revenue by ticket type, by discount code and by group or table purchase.
- Attendance data: who actually showed up, when they checked in, and which sessions or workshops they attended.
- Engagement data: app usage, session participation, poll and trivia responses, scavenger hunt completions.
- Exhibitor and sponsor data: booth visits, scanned leads, prize wheel spins or drawing entries.
- Feedback data: survey responses and satisfaction scores.
- Outcome data: leads converted, members renewed, credits issued, hires made.
The analytics part is connecting these. A registrant who bought a premium ticket, attended three workshops and scanned at five booths tells a very different story than the same person viewed in four separate spreadsheets.
Start with objectives, not metrics
The most common measurement mistake is collecting everything and deciding later what it means. Event Marketer’s measurement column makes objectives the first step: agree on measurable goals with all stakeholders, then ask what you want attendees to do, think and say. Each answer points to the data you need.
A few examples of how goals translate:
| Goal | What to measure |
|---|---|
| Grow paid attendance | Registrations by week, by registrant type, by discount code |
| Deliver training with credits | Session attendance per registrant, credits issued |
| Prove value to sponsors | Booth visits, leads captured, giveaway participation |
| Recruit talent at a career fair | Candidates scanned per recruiter, booth traffic by time slot |
| Improve the experience | Survey scores, session ratings, app usage |
The same event can have several goals, but each stakeholder should see only the numbers tied to theirs.
The KPIs worth tracking
Freeman’s Modern Event Measurement guide sorts event metrics into five groups: satisfaction, financial, attendance, conversion and engagement. That is a practical checklist.
Attendance metrics
Registration count, show-up rate (attendees divided by registrants), demographics and geography. Show-up rate is the one planners most often skip, and it is the one that sizes catering, staffing and badge stock for the next event. It requires reliable check-in data. QR check-in and attendance tracking captures arrivals as they happen, and QR check-in runs free on any smartphone.
Engagement metrics
Session attendance, app usage, Q&A and poll participation, networking and content downloads. For multi-track events, session-level attendance shows which topics fill rooms and which do not. For training and CE providers it doubles as proof: who attended which session or workshop, and which credits that earns.
Financial metrics
Revenue, cost per attendee, sponsor contributions and how ticket pricing performed. Payment data tied to registrant types shows which offers sold and which discounts moved people to register.
Conversion metrics
Leads generated, follow-up meetings, sales closed and buying intent. These matter most for exhibitors, sponsors and recruiters, and they are covered in the sponsor section below.
Satisfaction metrics
Net promoter score, survey ratings, testimonials and social sentiment. These explain the numbers above: low show-up plus low satisfaction is a different problem than low show-up alone.
How to measure engagement across sessions and booths
Engagement is harder than attendance because it happens in many places at once. A workable approach has three layers.
- Entry: scan every attendee at the door so each person has a timestamped arrival.
- Rooms: scan or record attendance at each session and workshop, linked to the same attendee record, so you see per-person paths instead of room headcounts.
- Activities: record interactions that signal intent, such as gamified challenges, scavenger hunt completions, trivia participation and booth scans.
rsvpBOOK’s engagement tools, including gamification, scavenger hunts, trivia and SMS reminders, produce this activity data inside the same record as registration and check-in. An organizer can then ask which registrant types completed the most activities, rather than merging exports by hand.
If your event includes a mobile experience, an attendee mobile app with personalized agendas and messaging gives attendees a reason to open it, and app activity becomes one more engagement signal.
Exhibitor and sponsor analytics
Sponsors renew when they can see what they got. For trade shows, the numbers they care about are traffic, qualified conversations and follow-up.
Lead retrieval turns booth conversations into records: who visited, what they were interested in, and who should follow up. Booth giveaways add a live moment that draws visitors in. rsvpBOOK offers an Instant Prize Wheel and a live Winner Drawing, and the trade show giveaway tools turn booth visits into qualified leads. Standalone booth giveaway tools start at $99 per event, so an exhibitor or a small show can use them without a full event platform.
For reporting these results to sponsors, a clear marketing dashboard with decision-ready metrics helps keep the focus on a handful of numbers rather than every available count. Organizers can also use interactive booth maps and exhibitor information kiosks to give exhibitors a visible, trackable presence on the show floor.
Career fairs
For campus recruiters and career fair hosts, the useful numbers are candidates captured per recruiter and booth traffic over the day. The same lead retrieval and giveaway tools apply: a prize wheel spin or a drawing entry brings a candidate to the table, and the scan records who they are for follow-up.
Calculating event ROI
ROI answers one question: did the event return more than it cost? The Event Planner Expo gives the standard formula: (event return minus event cost) divided by event cost, multiplied by 100. It also describes a simple ratio (event value divided by event cost, such as 3:1) and cost per qualified outcome for goals like leads, meetings, demos or hires.
A worked illustration with made-up numbers: an event costs $20,000 all in and produces $30,000 in attributable return. The calculation is ($30,000 minus $20,000) divided by $20,000, times 100, which is 50%.
The weak point is almost always the cost side. The same guide says total cost should include venue, production, speaker fees, travel, food and beverage, staffing, sponsorships, exhibit design, marketing, technology, agency partners, shipping and post-event content. Leaving out staff time or technology makes the result look better than it is, and a board will notice.
A second caution comes from the ROI Institute approach summarized by GreatEvent: revenue alone overstates return, because delivering what was sold also costs money. Report intangible benefits next to the figure instead of forcing them into dollars.
What you need on hand to calculate it:
- Registration and payment totals by type
- Sponsor and exhibitor revenue
- A complete cost ledger
- Outcome data for the goal (leads, renewals, hires, credits)
The first two come straight from the registration and payment records. The outcome data comes from exhibitor scans, surveys and your follow-up.
Post-event analysis: a five-step routine
Post-event analysis is the structured review that turns raw data into decisions. Event Marketer outlines five steps: set measurable objectives, create a data-capture plan and budget, capture data (adjusting in real time during longer events), analyze, and report.
In practice:
- Restate the objectives at the top of the report, so every result is read against a goal.
- Group the data into meaningful categories, then look for patterns.
- Compare against previous events and, where you have them, industry standards. Freeman advises this and also warns against jumping to conclusions from incomplete data.
- Interpret: say what worked and what to change next time.
- Tailor the report to each audience. A board wants ROI, a sponsor wants leads, a program chair wants session ratings.
Automated alerts help during the event itself. Instead of finding out afterward that a workshop sold out or registrations stalled, the team is notified while there is time to act. Custom reports then handle the post-event view without rebuilding spreadsheets each time.
Data quality problems to catch early
Bad data produces confident wrong answers. Three problems come up repeatedly.
Double counting. A guide to evaluating special events from the Pacific Asia Travel Association notes that organizers often count each day’s attendance by the same person as a separate attendee, which inflates headcounts. Report unique attendees and attendee-days separately.
Biased surveys. The same guide explains that survey samples lean toward frequent attendees, who are more likely to be approached and to respond. Keep this in mind before treating a satisfaction score as representative of everyone.
Fragmented systems. When registration lives in one tool, check-in in another and exhibitor scans in a third, matching people across them is slow and error-prone. Duplicate names and mismatched emails are the usual result. A single attendee record avoids most of it.
A short pre-report checklist:
- Is each person counted once?
- Do registration, check-in and session counts reconcile?
- Are survey respondents a fair mix of attendee types?
- Are all costs in the ROI calculation?
Why one connected record matters
Most event teams do not lack data. They lack a way to read it together. Registration, payments, sessions, onsite operations, exhibitor programs, engagement and reporting each produce numbers, and the insight usually sits between them: which registrant type attends the most sessions, which sponsor tier gets the most booth traffic, which discount code brought people who actually showed up.
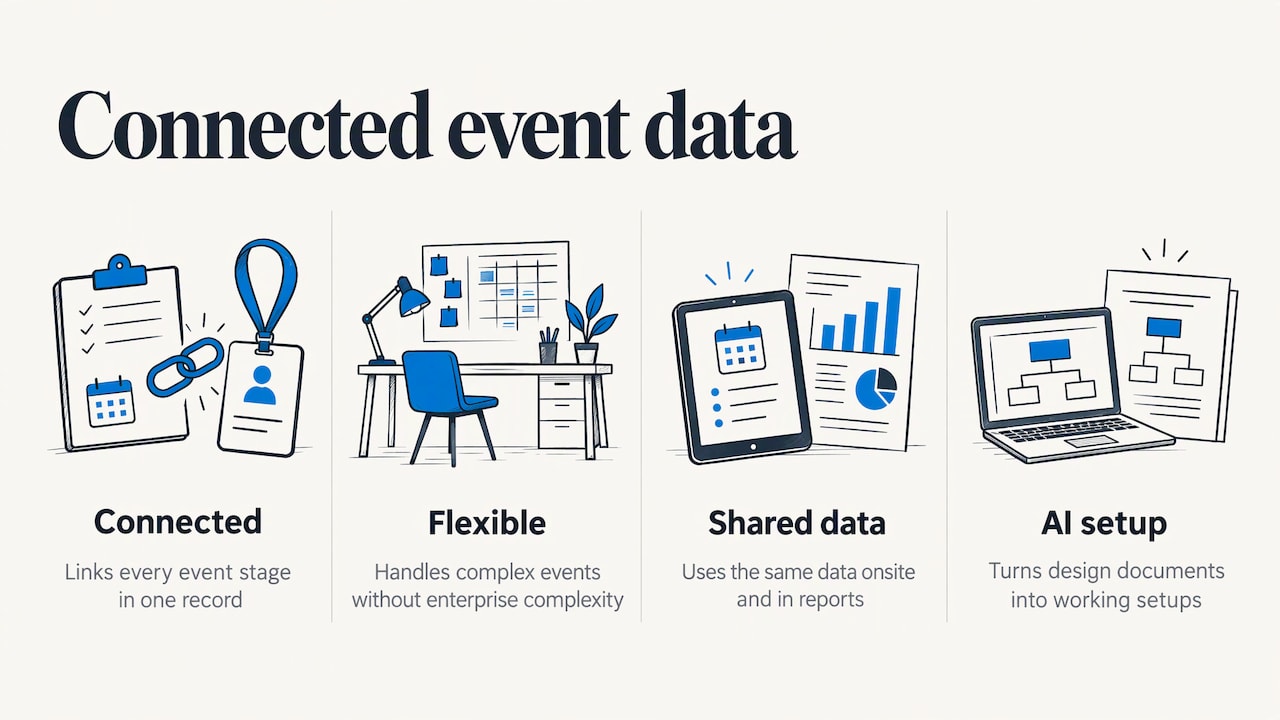
rsvpBOOK is event management and registration software that connects every stage of an event in one record, so organizers are not working across disconnected systems. It offers flexible configuration for complex events without the complexity of enterprise platforms, which makes it a practical alternative for teams that find large enterprise event suites more than they need. Teams can build a branded registration site with custom questions, registrant types, group and table registration, discounts, sessions and surveys, then use the same data onsite and in reports. An AI-assisted builder turns an event design document into a working setup quickly.
Our perspective
We have supported event organizers since 2004, and one pattern holds across corporate meetings, association conferences, trade shows and career fairs: analytics fails when the data is split up, not when it is missing.
Planners tell us the hard part is rarely deciding what to measure. It is pulling registration, check-in, session and booth data into one place before the board meeting. That is why we build around a single record, so the question “who came, what did they do, and what did it produce” has one answer.
Our advice is simple. Pick three to five metrics tied to your goals, capture them as the event happens, and report them to each audience in the form it needs. Add engagement tools like gamification or a prize wheel when you want booth activity you can count, not just crowds you can see.
We also know every event needs a different setup. Some teams build it themselves, and some want hands-on implementation support. We offer both.
Droshawn
Put your event data to work with rsvpBOOK
rsvpBOOK handles registration, payments, onsite check-in, exhibitor lead retrieval, engagement tools and custom reporting in one platform. Event management software from rsvpBOOK is priced per registration, with discounted rates for nonprofits and government organizations. Hands-on implementation support is available when an event needs it.
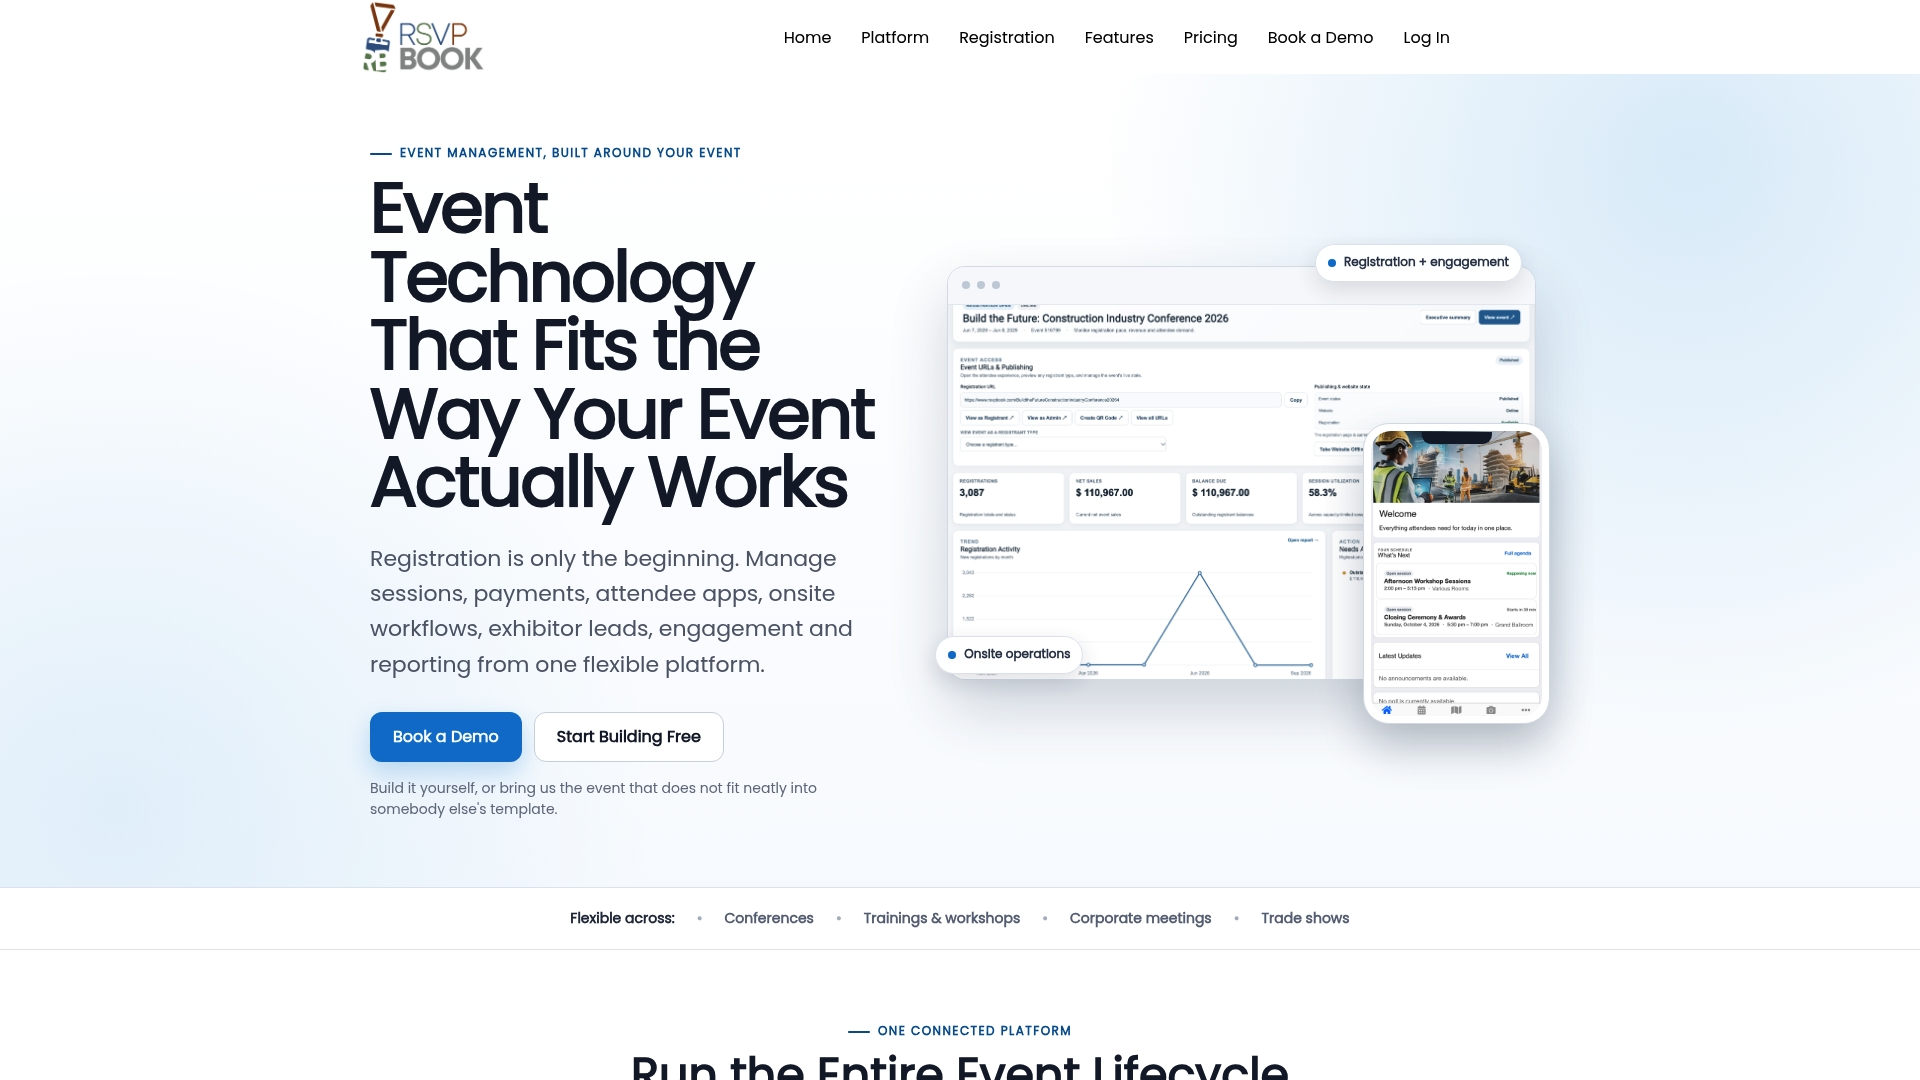
Onsite, badge printing and check-in kiosk hardware are optional add-on rentals. If you only need booth activity, the standalone giveaway tools start at $99 per event. See the full list on the features page or the pricing page.
FAQ
What are the four basic types of analytics?
The four common types are descriptive (what happened), diagnostic (why it happened), predictive (what is likely next) and prescriptive (what to do about it). Most event teams get the most value from descriptive and diagnostic work: attendance, engagement and ROI, then reasons behind them.
What is post-event analysis?
It is the structured review after an event that compares results against the original objectives. A good report restates the goals, shows the data, and explains what worked and what to change next time. It is written for each audience, such as sponsors, leadership or program teams.
What are KPIs for events?
KPIs are the few metrics tied directly to your goals. Common groups are attendance (registrations, show-up rate), engagement (session attendance, app use), financial (revenue, cost per attendee), conversion (leads, meetings) and satisfaction (surveys, NPS). Choose the ones that match your objectives instead of tracking all of them.
How do I get started if my data is spread across tools?
Begin by listing your goals and the metrics each needs, then move registration, check-in, session and exhibitor activity into one system so every number ties to the same attendee. rsvpBOOK offers self-service setup or hands-on implementation support for teams that want help.
Sources
- Guest Column: Measurement, The Doing (Event Marketer)
- Modern Event Measurement (Freeman)
- How to Measure Event ROI: A Planner’s Guide (The Event Planner Expo)
- How to Measure Event ROI: KPIs and Post-Event Report (GreatEvent)
- Economic evaluation of special events (PATA)
- Marketing Dashboard Metrics That Drive Decisions
Ready to see your event data in one place? Book a demo or start building an event free.
Recommended
- How to Track Event Attendance: Methods, Tools and CE Records
- Event Marketing Strategies That Fill Seats and Capture Leads
- Event Payment Processing: How to Collect, Track and Reconcile
Planning an event that doesn’t fit neatly into somebody else’s template? See how rsvpBOOK handles registration, onsite check-in, lead retrieval and engagement in one platform. Book a demo: https://www.rsvpbook.com/book-a-demo
